Data is not only something you can see—it’s something you can touch! At CityLAB, we developed a special workshop format that translates personal data into colorful acrylic forms, creating individual data physicalizations. This results in a tangible, aesthetic object that is not only beautiful but also invites reflection on one’s own data and its role in our world.
Data is World Experience
“Data represents real life. It is a snapshot of the world, in the same way that a picture catches a small moment in time. Numbers are always placeholders for something else (…)”
Giorgia Lupi
Giorgia Lupi, the grande dame of data visualization and author of The Data Humanism Manifesto, practices visualizing data as an approach to understanding the world. We all encounter data every day. We consume and produce it with swift, effortless movements of our fingertips: clicking through consent pop-ups and privacy notices, sharing private locations, allowing what feels like a ton of digital cookies in our browsers, saving countless login passwords and codes, and even sharing our faces or fingerprints to unlock devices.
Sometimes we have the choice to say yes, but often our data is simply anonymized and stored without our knowledge.
I Data, Therefore I Am
Just through online shopping alone, data such as page visits, dwell time, bounce rate, or purchasing preferences are collected in split seconds. Soon, you may be categorized and assigned to an age and interest group in a demographic cluster. Microtargeting foundations are laid, and personalized advertising can begin. Add to this the highly personal tracking via your smartphone or wearables: How much screen time have you had today? How many steps have you taken? Was your REM sleep phase long enough?
Data Literacy – A New Basic Competence
When you start thinking about data, you eventually arrive at a critical question: how can we gain more power over our own data? A meaningful first step is data literacy. This modern concept describes the ability to understand how data are collected, analyzed, and used today. But “data” often conjures Big Tech, Big Data, and statistics—way too dry and overwhelming.
Data Physicalization – A Human Scale
The good news is that data can be fun. After all, data is the smallest possible unit of information. Beyond classic numbers, data can also be words, images, emotions, objects—even ephemeral things like scents. In other words, anything that can be counted, recorded, and stored.
With methods from data physicalization, data become tangible. In scientific terms: “(A) physical artifact whose geometry or material properties encode data.” (Jansen et al., 2015)
Everyone Wants to Touch Data
Physicalizations of data are ancient. Over 40,000 years ago, Stone Age people carved notches into the Lebombo bone to mark events—whether lunar phases or perhaps a score in hunting mammoths, the story remains silent. But the need to record data is as old as humanity itself.
Today, tactile data appear in many fields: in education and research, hands-on models help make theories literally graspable—think DNA double helix models. Urban planners employ participatory data collection in public spaces to ask residents about planned projects, fostering collaborative decision-making. A CityLAB project called “Kiezpuls” in their local lab uses a playful thread-pulling approach to gather residents’ opinions on city issues. Museums, universities, and innovation labs adopt gamification—like the ODIS “Top Trumps” game—to teach data literacy in a playful way. Artists use data as a design foundation, transforming urgent issues like climate change or gender equality into data-based artworks.
Our Workshop: From Data Collection to Keychain
In interface design studies, one learns that the best interface for a human is another human. This challenges traditional digital data visualization formats like interactive maps or infographics. Our workshop aims to align data interaction with human scale.
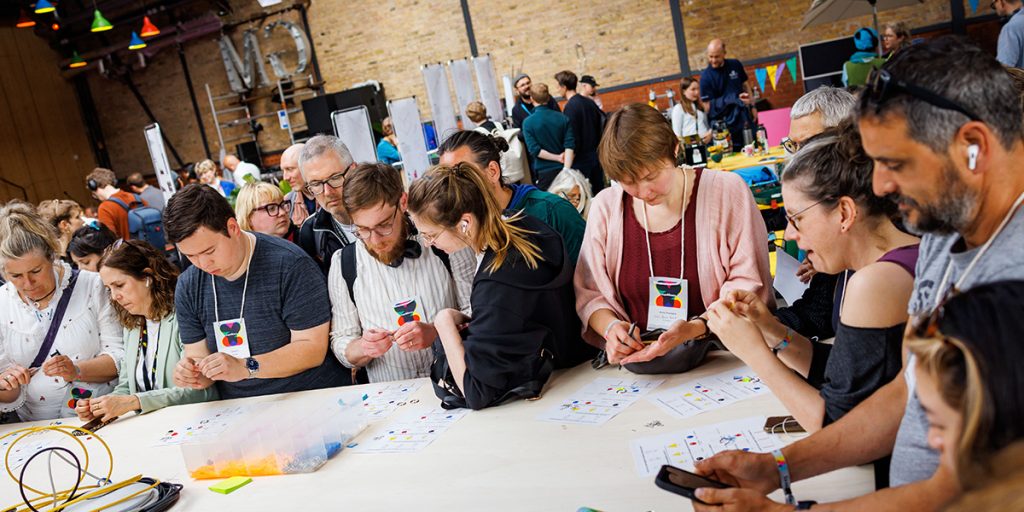
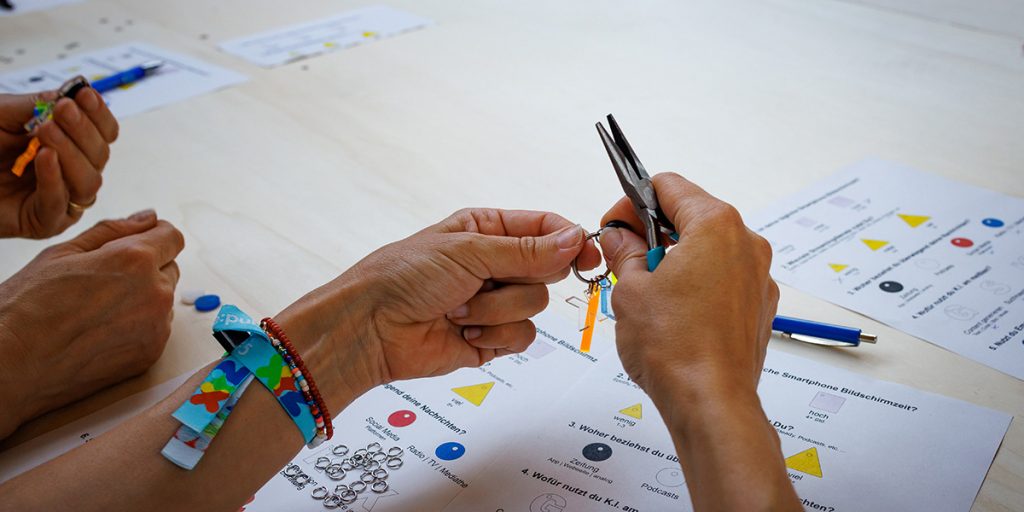
At the workshop’s start, participants become data donors, transforming their individual responses into data. Depending on the format, questions may be developed collaboratively or individually. In the next step, answers are assigned to corresponding acrylic shapes, and the creation of a keychain begins—providing space for exchange and personal data stories. You gather, you create—a process spanning from 40,000 years ago to today.
“Transforming data to symbols causes us to see it and therefore react to it.”
Lydia van der Speck
The final keychain serves as an exercise in handling your own data, a foundational lesson in data mapping, and as a conversation starter—with fellow participants, friends, family, and across generations.
From Data to Design – How the Workshop Works
The goal is for participants to engage with their personal data, learn data visualization basics, and transform their data into suitable visual forms. Each participant leaves with a personalized keychain.
Preparation for each workshop breaks down into three phases:
- Theme and Question Selection
- Visual Mapping
- Assembly of Materials in a Workshop Kit
Theme and Question Selection
For the data-keychain, we carefully craft questions that both reflect the workshop theme and create personal relevance for participants. These serve as a starting point to make everyday data visible and meaningful. All questions are written on an A4 questionnaire and handed out to participants.
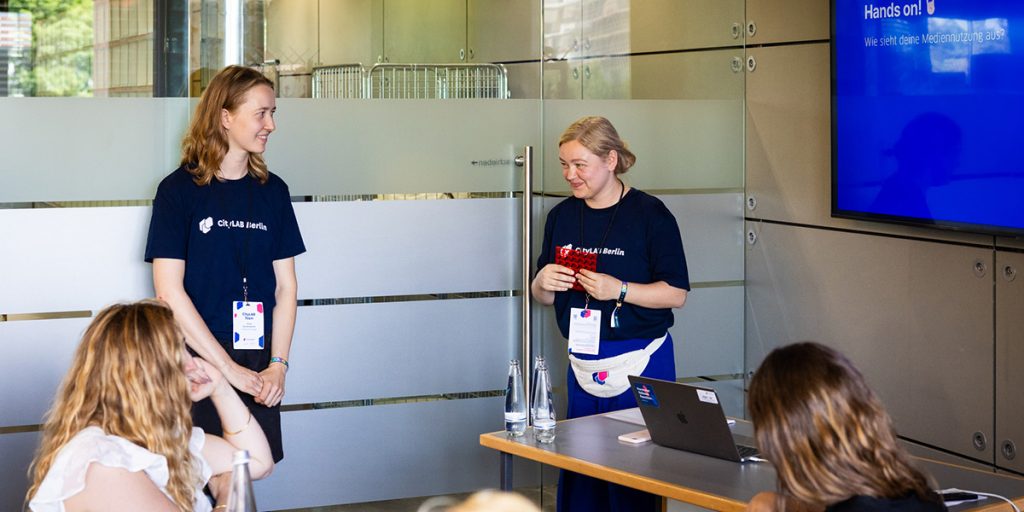
Example: In a re:publica workshop titled “Your media usage as a keychain,” the opening question was: “What is your daily smartphone screen time?” Such prompts aim to spark self-reflection about media use and forge an emotional connection to data. A key consideration in question selection is data availability—for example, screen time is often easy to access, as most smartphones track it.
The final question is left to the participants: they can choose a personally meaningful question and figure out how to map their answers onto the provided shapes.

Visual Mapping
The answers to the questions are translated into a visual language using varying colours, shapes and sizes. This allows participants to learn about different approaches to data mapping.
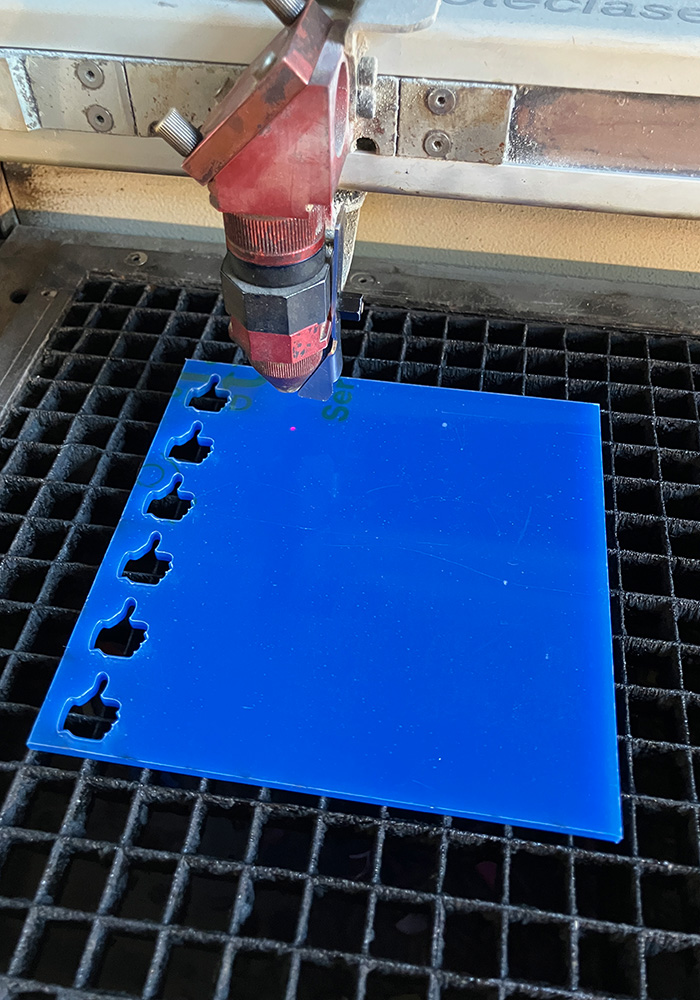
First, we define categories such as 1–2 hours, 2–4 hours or 4+ hours for screen time, for example. Then we determine the appropriate visual parameters: a light blue, transparent rectangle symbolises the screen area and its size reflects the intensity of use. In the final step, we use a laser cutter to create prototypes by cutting coloured acrylic glass elements to size – these will later serve as individual pendant shapes.
A tangible, personal object emerges from abstract information—one that can be carried around, serving both as a visual metaphor and a personal statement.
Workshop Kit
We prepare a compact kit for workshop implementation. It includes:
- Key rings
- Acrylic pendants in various shapes and colors
- Small, flexible loops for attaching elements to the main key ring
- Craft pliers to connect the pieces
- Questionnaires with pre-selected workshop questions and accompanying visual mappings
Let’s Data Together
We host this workshop in various formats, such as at re:publica, the CityLAB Summer Conference, or at different locations of the Kiezlabor. If you’re also interested in running or joining the workshop, feel free to reach out to us at info@citylab-berlin.org
Downloads
- Presentation Slides: Republica & SOKO25
- Data Physicalization and the Benefit of Haptic Shapes – Bachelor’s Thesis Anna Meide
- Visualizing Critical Infrastructures for Citizens – Master’s Thesis Anna Eschenbacher
- Acrylelemente-SVGs
- Datamapping Sheets: Republica & SOKO25
Sources
- Book: Making with Data (https://makingwithdata.org/)
- Article by Giorgia Lupi: “Data Humanism, The Revolution will be Visualized” (https://giorgialupi.com/data-humanism-my-manifesto-for-a-new-data-wold)
- Jansen, Y., Dragicevic, P., Isenberg, P., Alexander, J., Karnik, A., Kildal, J., Subramanian, S., Hornbæk, K. (2015). Opportunities and Challenges for Data Physicalization. Opportunities and Challenges for Data Physicalization. CHI 2015, Crossings, Seoul, Korea. http://dx.doi.org/10.1145/2702123.2702180