Gieß den Kiez – our platform for the Berlin tree-watering community – was one of the early prototypes we released at CityLAB in spring 2020. Since then, over 3,200 people are active watering trees on the platform, whereby trees have been watered with over 1.6 million liters of water.
The enthusiastic feedback we received motivated us to continue maintaining the platform over the past years. This is why this year, we took some time to add new features and improvements in a development sprint – as it was the case this October with our “fall clean-up”.
We set ourselves a tough task for the one week we had scheduled: to improve the loading times of Gieß den Kiez. When we originally released the platform in 2020, it was designed and developed as a prototype. The whole thing was a bit rough around the edges and while we weren’t too happy with the long loading times, we were accepted that for the time being, given the great benefits of the prototype. Now we are a few years further along and the project has grown out of its infancy and into a considerable community. That’s why we’ve decided to take a closer look at the loading times.
Why did Gieß den Kiez have such long loading times?
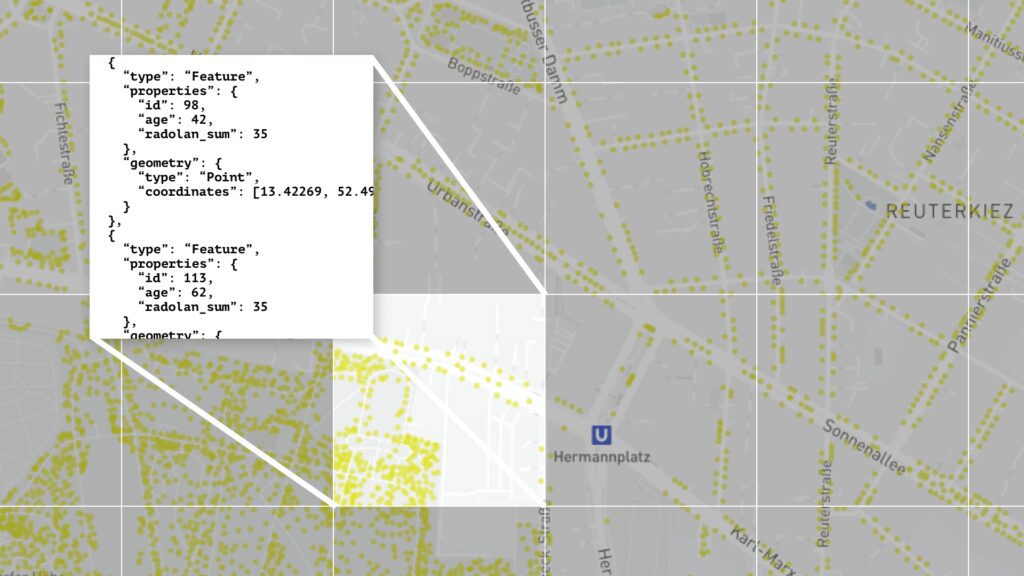
The platform shows most of Berlin’s 800,000 street and plant trees. Displaying this many trees on a web map draws heavily on resources and that can take time, especially on older devices or where you have a poor internet connection. Our technical approach in 2020 was not ideal. The tree data was saved in a CSV file – a format similar to an Excel spreadsheet. Every time the map was accessed, this file had to be loaded, processed and rendered.
Our approach would have worked well, but with smaller data sets. It makes a big difference whether you’re processing a CSV file with 800,000 rows or one with hundreds or just a few thousand.
But there are also solutions for large volumes of data where millions of data sets are involved. One common approach is to render the data using so-called “tiles”. Vector tiles in particular are well suited to displaying 800,000 individual points on a map.
What are vector tiles?
This is where things get a bit technical.
Vector tiles are a collection of square units that can be stored in individual files and accessed from a map application.
To put it simply, you might say that one tile unit contains a square map section of Berlin-Kreuzberg including the coordinates and information about all the trees in this section, for example. Then there’s another tile unit that contains information about all the trees in Neukölln. Combined with some other tiles, you get a grid of tiles (a so-called vector tile set) which contains the geographical information about all the trees in the metropolitan area of Berlin. Rendering these tiles on a map is significantly faster than our original approach. Tiles are also the option used by many large-scale, commercial map providers.
How do you create a vector tile set from a CSV file?
There are several ways to create vector tile sets: that’s not something we can explain in detail in this article. The key point is that the source data – in our case the CSV with the 800,000 trees – contains geographic information, for example longitude and latitude for points such as our trees or outlines showing geographical areas. The finished tile set then has to be made available on a tile server.
At CityLAB and Technologiestiftung, we sometimes use external services as tile servers for our applications, but we’ve also set up a tile server ourselves for the QTrees project, for example.
Vector Tiles in Gieß den Kiez
In order to use our vector tile set in Gieß den Kiez, we had to significantly restructure the code (also called “refactoring”) – which is one of the reasons we weren’t able to carry out this optimization earlier. Once this has been done, incorporating the vector tile set is ultimately a matter of a few lines of code.
Anyone interested can look at the functions addSource and addLayer in the source code. Here, all that is required is to specify a URL for the vector tile set. The geographical information within the tiles can then be stylized as desired. Those who are familiar with Gieß the Kiez will know that the trees show a different shade of green depending on the amount of rain, for example, and that certain trees are displayed with a red outline. These are typical style adjustments for objects in a vector tile set.
What has the optimization achieved?
If you open Gieß den Kiez today, you’ll notice that the website loads within one to three seconds (depending on your internet connection) – which is pretty good for a view of all of Berlin with all 800,000 trees.
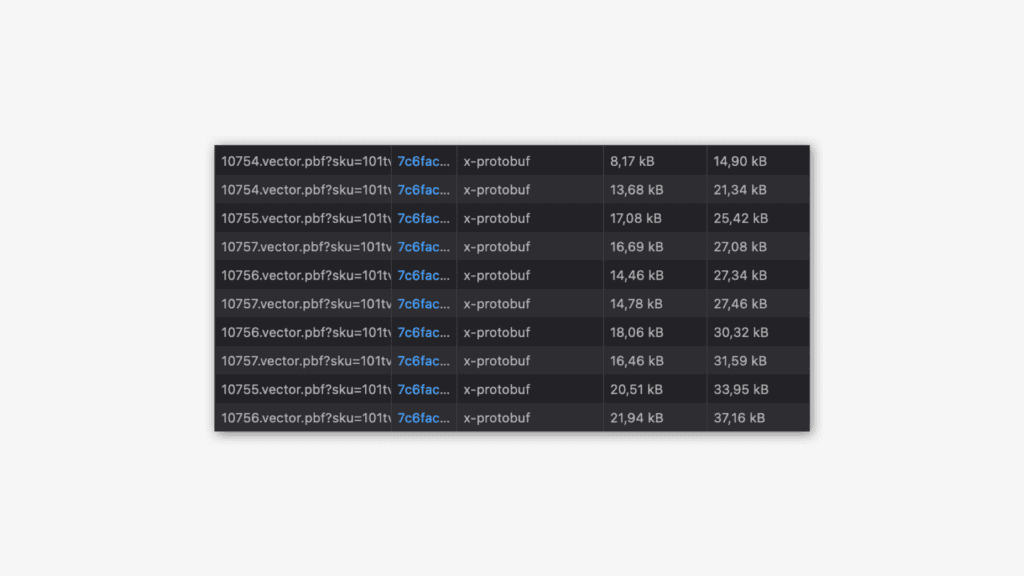
The Network tab in the browser console gives you a view of the requests to the vector tiles. Each tile unit is loaded here with the file extension .vector.pbf. There are large numbers of requests of this kind, but each of them only sends small amounts of data, namely the geographical information stored in the respective tile. This ensures that the page loads quickly, because only the vector tiles necessary for the current map section and zoom level are loaded. A few weeks ago, you would have seen a single request here that would have transferred one CSV file with many megabytes in size – which then required intensive processing and rendering of the data on the map.
What we have learned
Gieß den Kiez was created as a quick prototype by a small design and development team. Over the years, we’ve gained more and more experience of map applications and now finally have the resources to incorporate our new-found knowledge into Gieß den Kiez.
Today, we have a good idea of the amount of data that can be included with little effort using a simple CSV file, and at what point vector tile sets are a better option. This will be of enormous help with more recent projects. For example, our first prototype in the QTrees project shows the same 800,000 trees as Gieß den Kiez, but it has been optimized from the outset using a vector tile set – faster loading times included.
Bonus: other optimizations for the tree-watering community
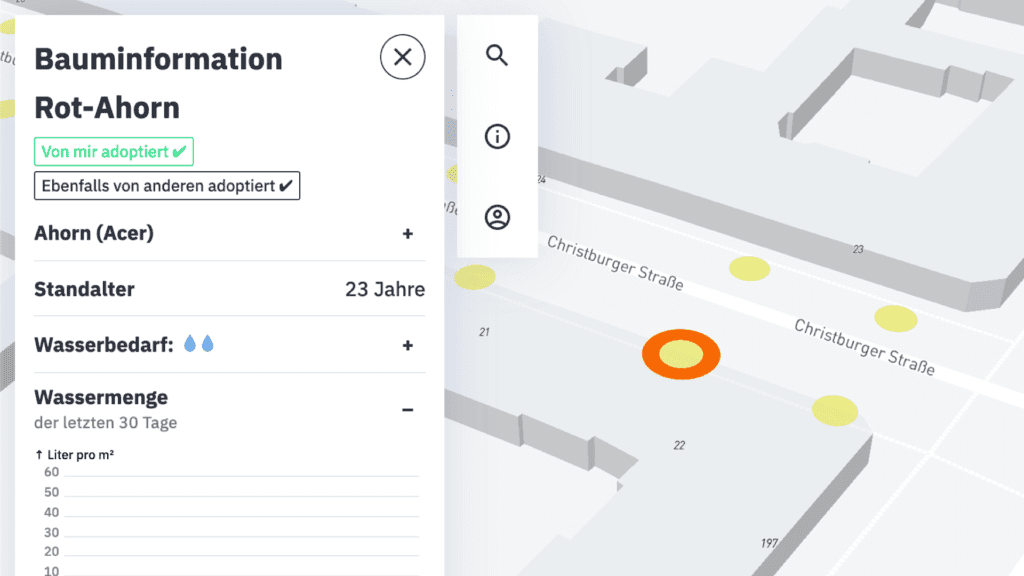
A brief note has been added to each tree showing whether or not it has been adopted and is therefore being watered. Here you can see if you have adopted a tree yourself or if others have adopted it. This helps avoid duplicated tending and watering of trees.
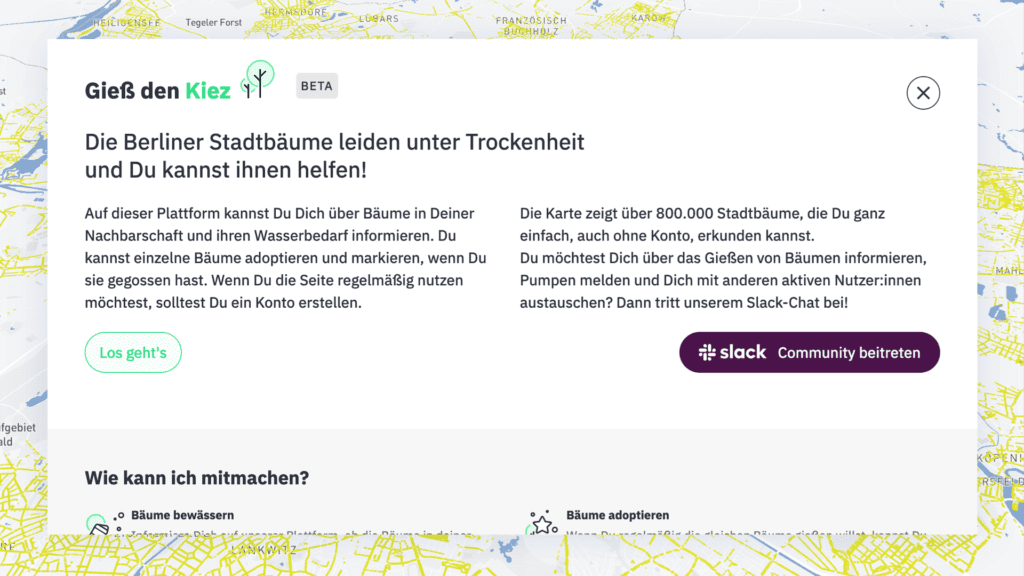
To make more recent members of the tree-watering community aware of our Slack channel, there is now a prominent link to the community chat on the home page. This makes it much easier for people to sign up and network with other tree-waterers around the city.
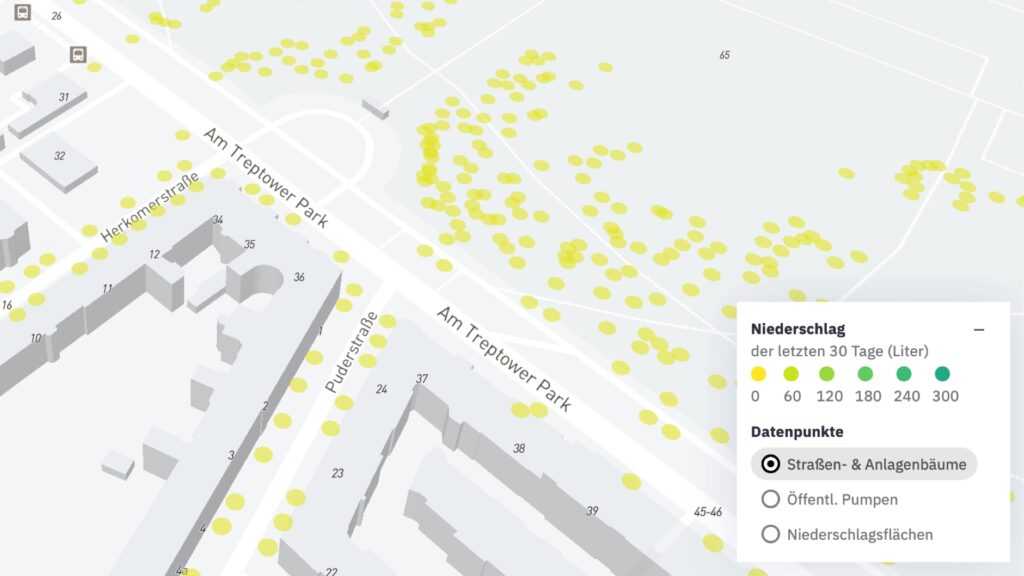
The different layers of the map can be selected in the legend: trees, public pumps for fetching water and rainfall areas. The selection and explanation were a bit complicated before, so now we’ve simplified the elements: we hope this will make the map easier to use.
We’re delighted that Gieß den Kiez continues to be so well received by the urban community and that we can contribute to improving the quality of life for both nature and people through the creative use of open data provided by the Berlin municipal authorities. If you feel like supporting Berlin’s trees, see giessdenkiez.de and our Slack channel to get started.