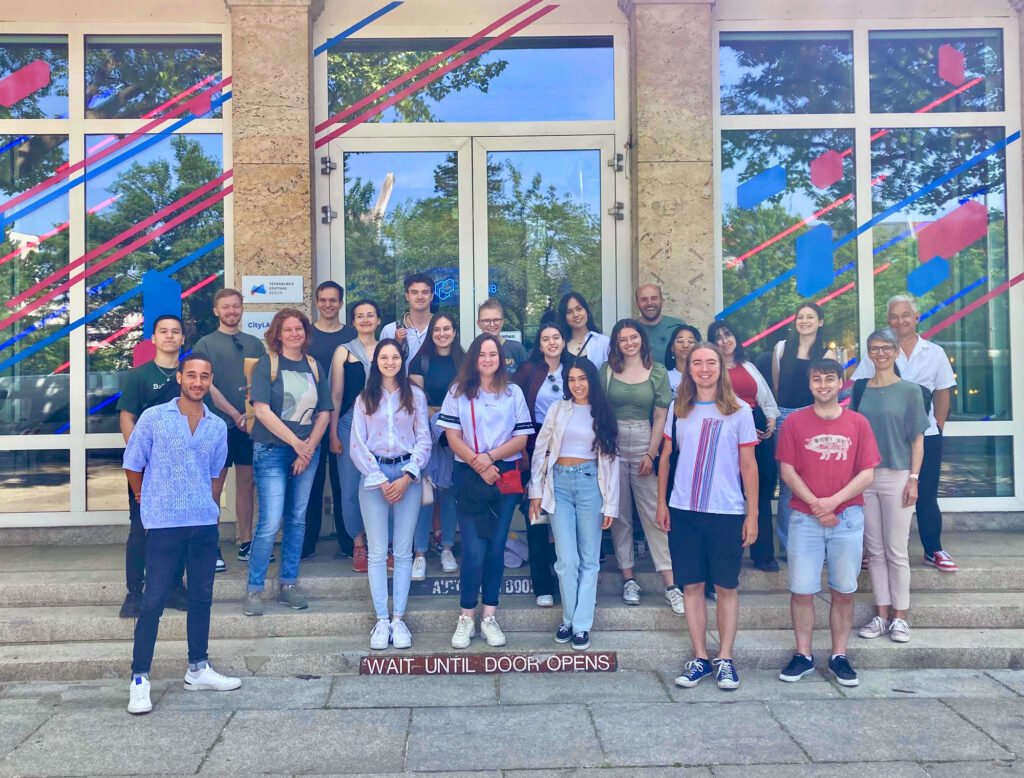
If there ever happens to be a group of students standing outside the doors of CityLAB with their sleeves rolled up, we’re more than happy to let them in! One good example of this is the students on a course offered by Amsterdam University of Applied Sciences who visited us last year as part of an excursion to Berlin. Particularly focused on interaction design as part of their design studies, the students showed great interest in our topics, so we gave them a few challenges to take home with them. In this article, we talk about what came out of this and provide a glimpse of our projects.
Too many technical terms? For the ultimate overview, check out our glossary, which explains all the buzzwords and favorite words in our universe once and for all.
Bye Bye, Bicycle!
Unlike cats, bicycles unfortunately only have one life – and in Berlin it is often a comparatively short one. Some time ago, the team of the Open Data Information Service (or ODIS for short) has been assisting the Berlin police in providing an open data set on bicycle thefts in Berlin. Would you have thought that by mid-February, more than 2,000 bicycles were stolen in Berlin this year? Updated daily, this dataset tells us where and what kind of bikes were stolen, and even what the financial losses were. Here is an example of what can be done with a data set of this kind:
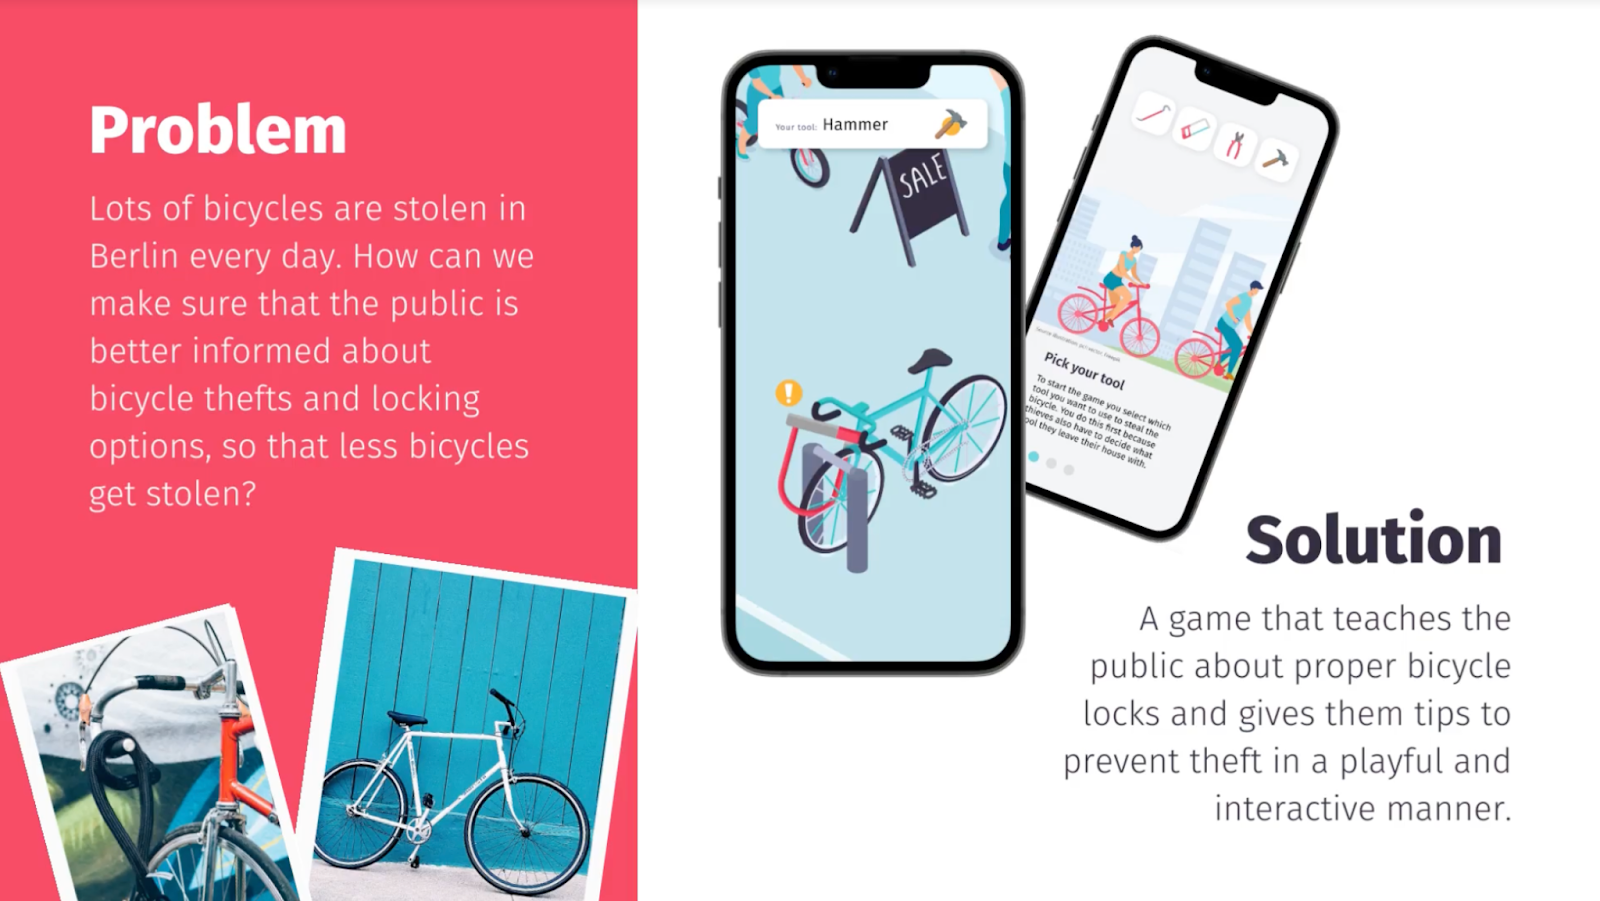
Could you steal a bike? That’s what student Mirthe Vader asked us when she shared a great idea with us: posters referring to the relevant application could be put up near areas where people park their bicycles, such as in front of train stations or at shopping centers. Just scan the QR code and a tutorial explains the rules of the game: you’re a bike thief, so you have a clear “mission”. Certain factors can be changed, such as the tools you have for the theft, the setting, and the type of bike lock, so this allows different levels of difficulty in achieving the goal. This playful approach focuses on the whole issue of security; each scenario that is played out is followed by tips on how to enhance theft protection. We were fascinated by the change of perspective as well as the hands-on yet high-quality UX design!
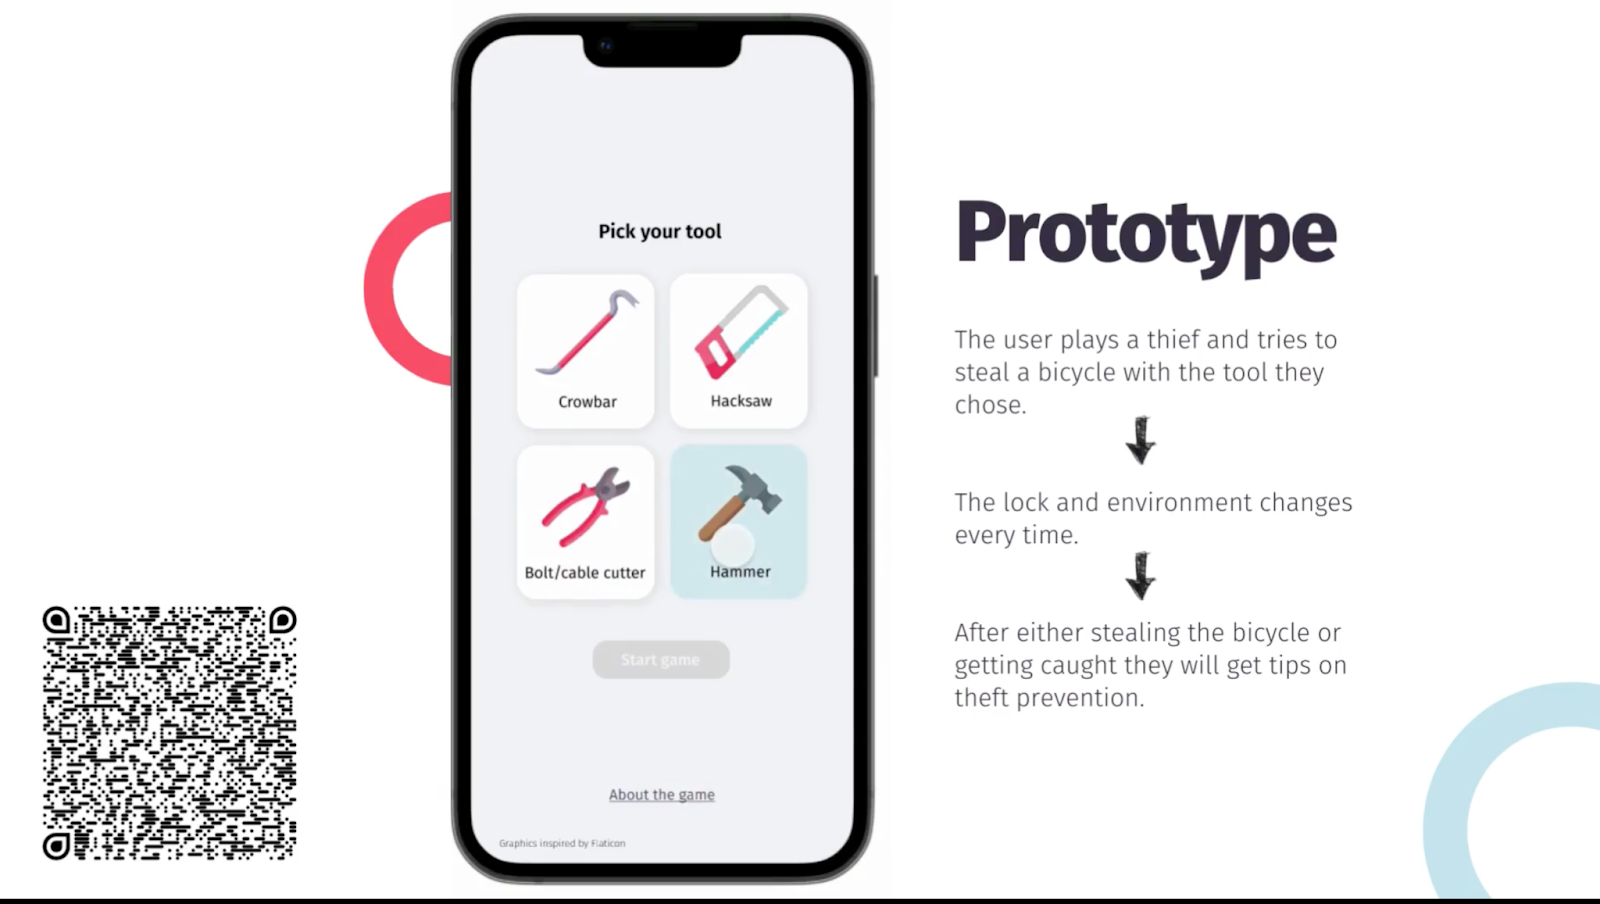
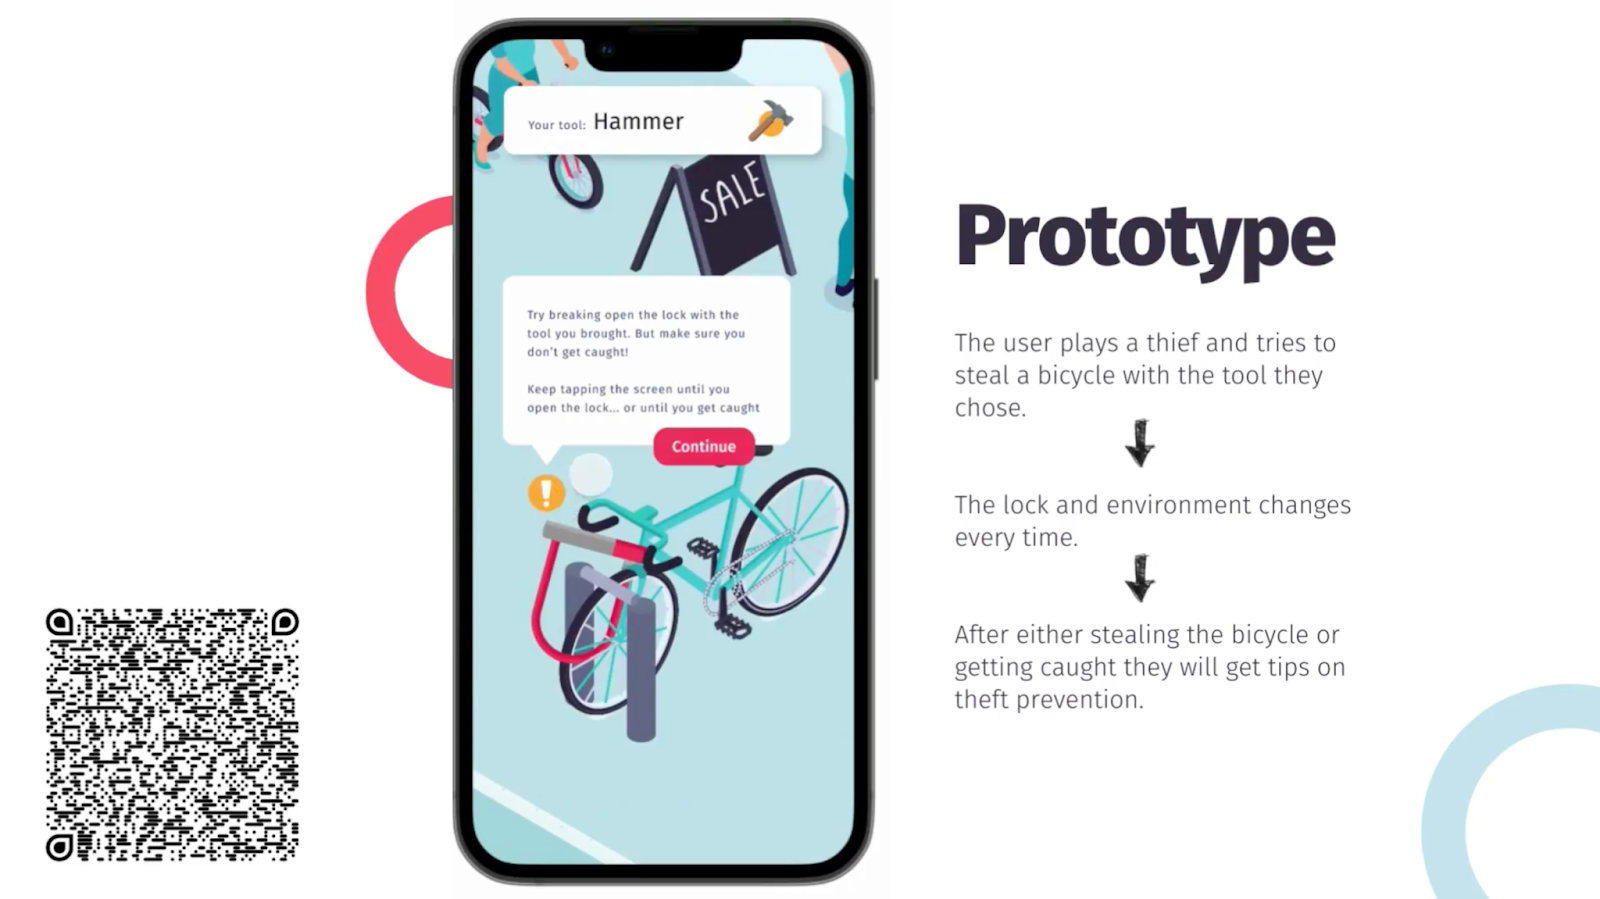
Screenshots: Mirthe Vader, Student, University Amsterdam
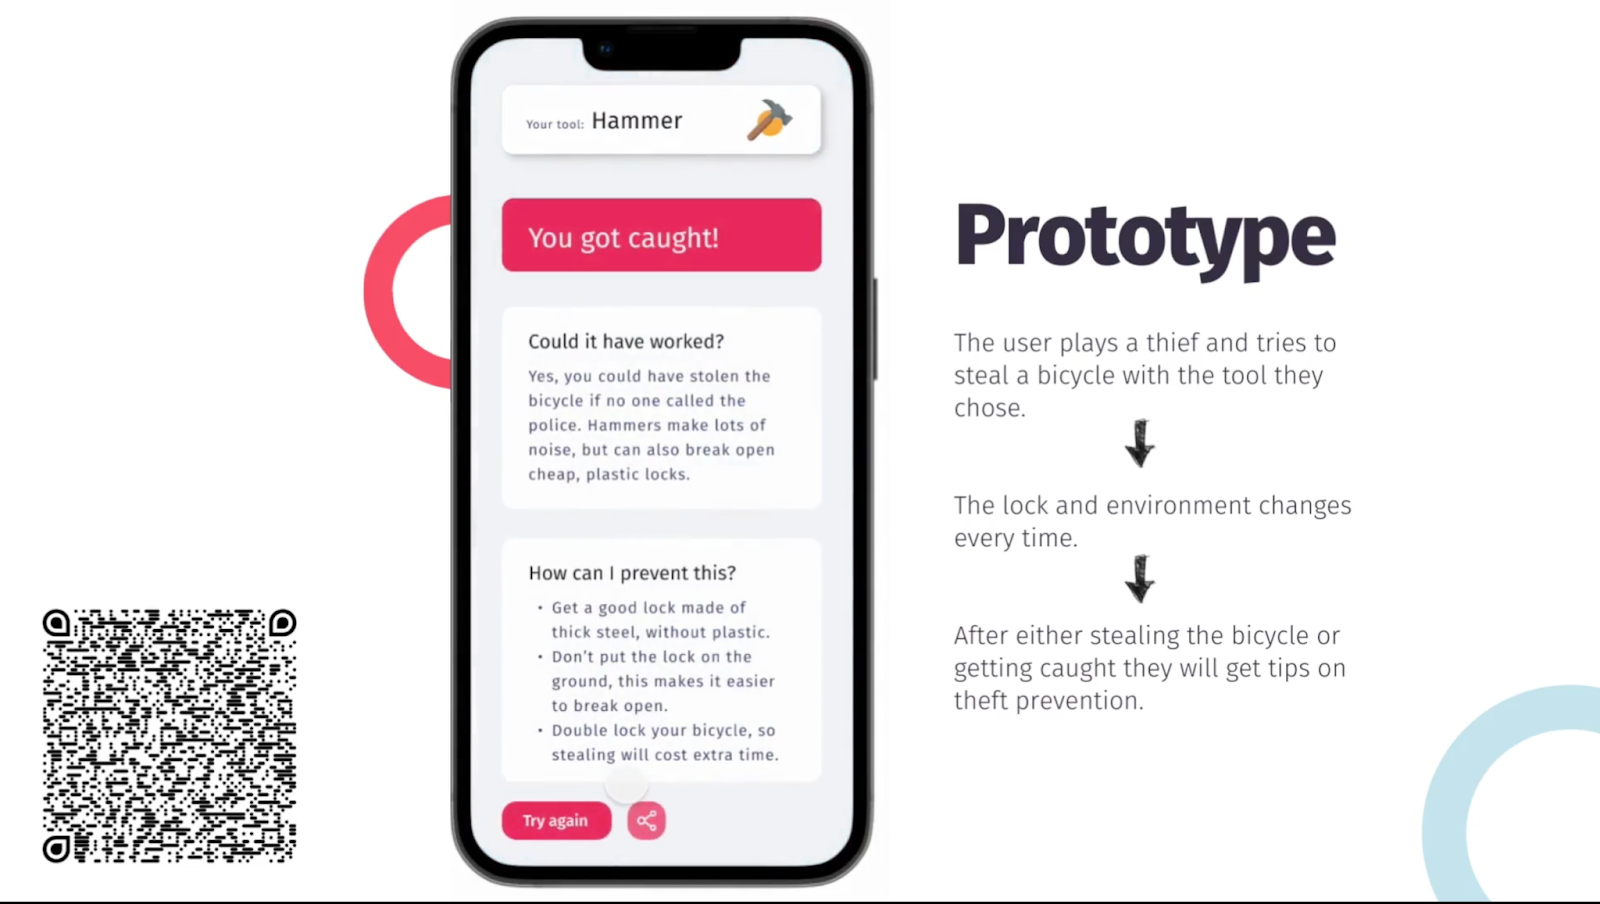
Lisa Stubert, head of the Open Data Information Service (ODIS), is a fan of the prototype and adds: “There’s so much in terms of potential and use cases for open data sets like the one on bicycle theft in Berlin. This is demonstrated by the applications that have already been created, such as “Is my bike safe here?” which contextualizes the data for a particular neighborhood, for example. Grand Theft Bike gives users a nice visual overview. Mirthe’s prototype demonstrates another fascinating use case which the data providers weren’t even aware of before. The focus here is on precautionary measures, and it also makes it fun to use open data. In doing so, it presents the information again but for a completely different target group. – We need more creative approaches like this!”
Moving around efficiently
Whether they’re off to a dinner date or heading to work in the morning, people are constantly on the move in the city. So at CityLAB and Technologiestiftung Berlin, we were interested to look into the question of how many people are actually moving around, as well as when, where and by what means of transport. It was possible to draw fascinating conclusions from the movement data, for example in terms of traffic planning and space allocation. The research project freemove takes a more precise look at this mobility data, exploring the aspects of anonymization and transparency in both provision and use. Among other things, the project is looking to create a concrete framework that combines the legal, social and technical perspective. This framework is to be made accessible via a platform. One suggestion for how this platform might be structured comes from student Evi van der Linden. The challenge is essentially to prepare information in a way that is equally comprehensible and transparent for the citizens, public actors and companies who are involved in handling or processing the data.
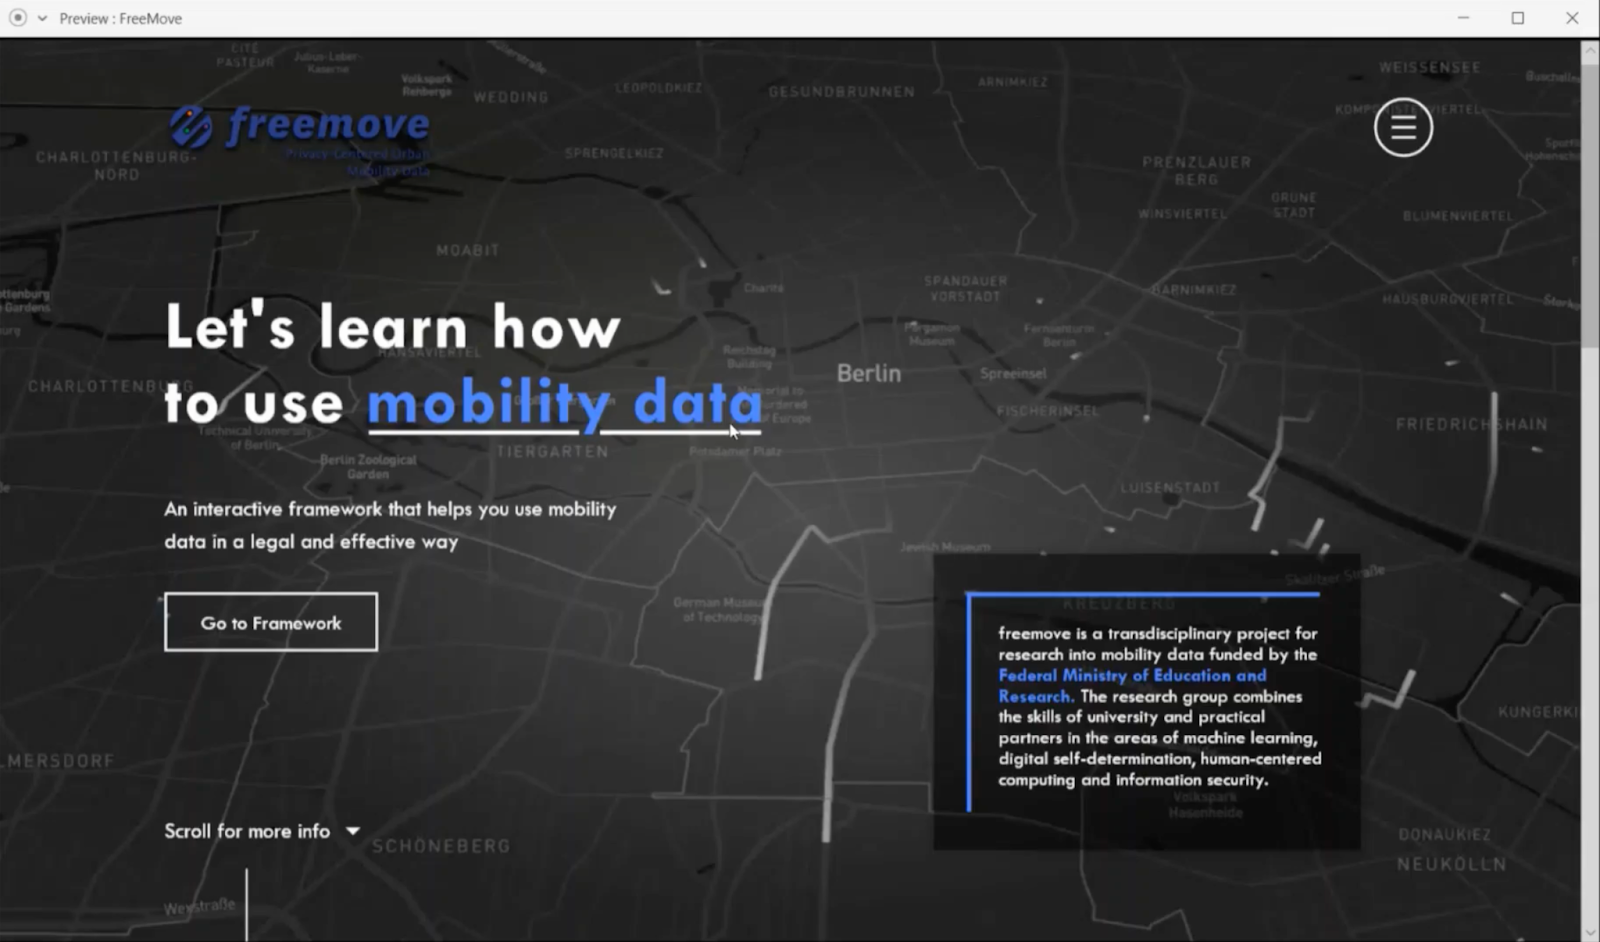
Screenshots: Evi van der Linden, Student, University Amsterdam
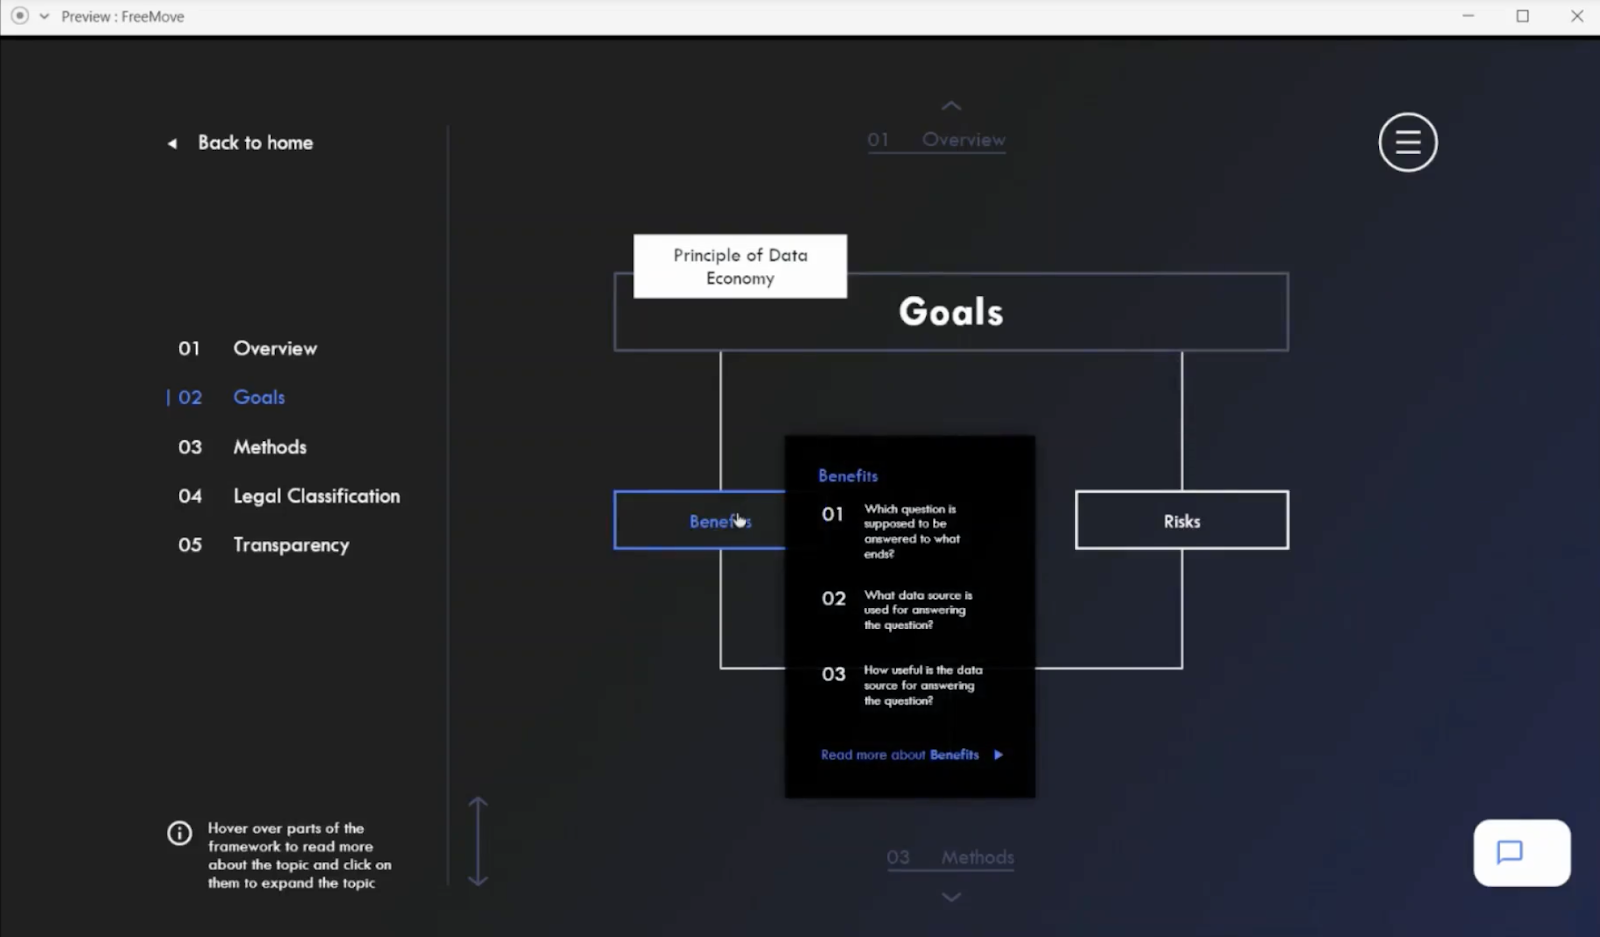
Student Evi van der Linden opts for a clearly laid out homepage that offers a concise explanation of the project. From here, you can easily access information about mobility data and also the guidelines – the so-called Framework. It’s quite challenging to attribute the research results to clearly recognizable categories and break down the goals, methods, legal classification, and transparency so as to enable a swift overview of the different areas.
“When you work with different scientific perspectives on a joint project, the outcomes are automatically more diverse and seem more complicated at first,” explains Markus Sperl, project manager of the research project freemove. “We’re inspired by Evi’s ideas and the interactive presentation geared towards the target groups. The challenge was tackled supremely well: the prototype is intuitive and informative.”
For the latest information on the project, see freemove blog.
AI is not for playing with! Or is it?
A city tree in Berlin doesn’t always have an easy life: limited rainfall, dog urine, compacted soil from broken washing machines standing next to the tree; there are lots of stress factors. But there also lots Berlin residents who plant tree plots and water them eagerly! How can we provide even better data-driven support for these initiatives? The project Quantified Trees (or QTrees: for short) involves an interdisciplinary team working on an artificial intelligence (AI)-based prediction system that draws on a range of data to identify urban trees particularly at risk from drought stress at an early stage, thereby helping to stop tree mortality in Berlin in the long term. Two platforms are being developed that will enable both the public administration and civil society in Berlin to care for the city’s trees and respond better to dynamic weather conditions in the future – aimed at both experts and ordinary citizens. The challenge is to design a platform that allows interested parties to find out about the condition of the trees so they can take action themselves.
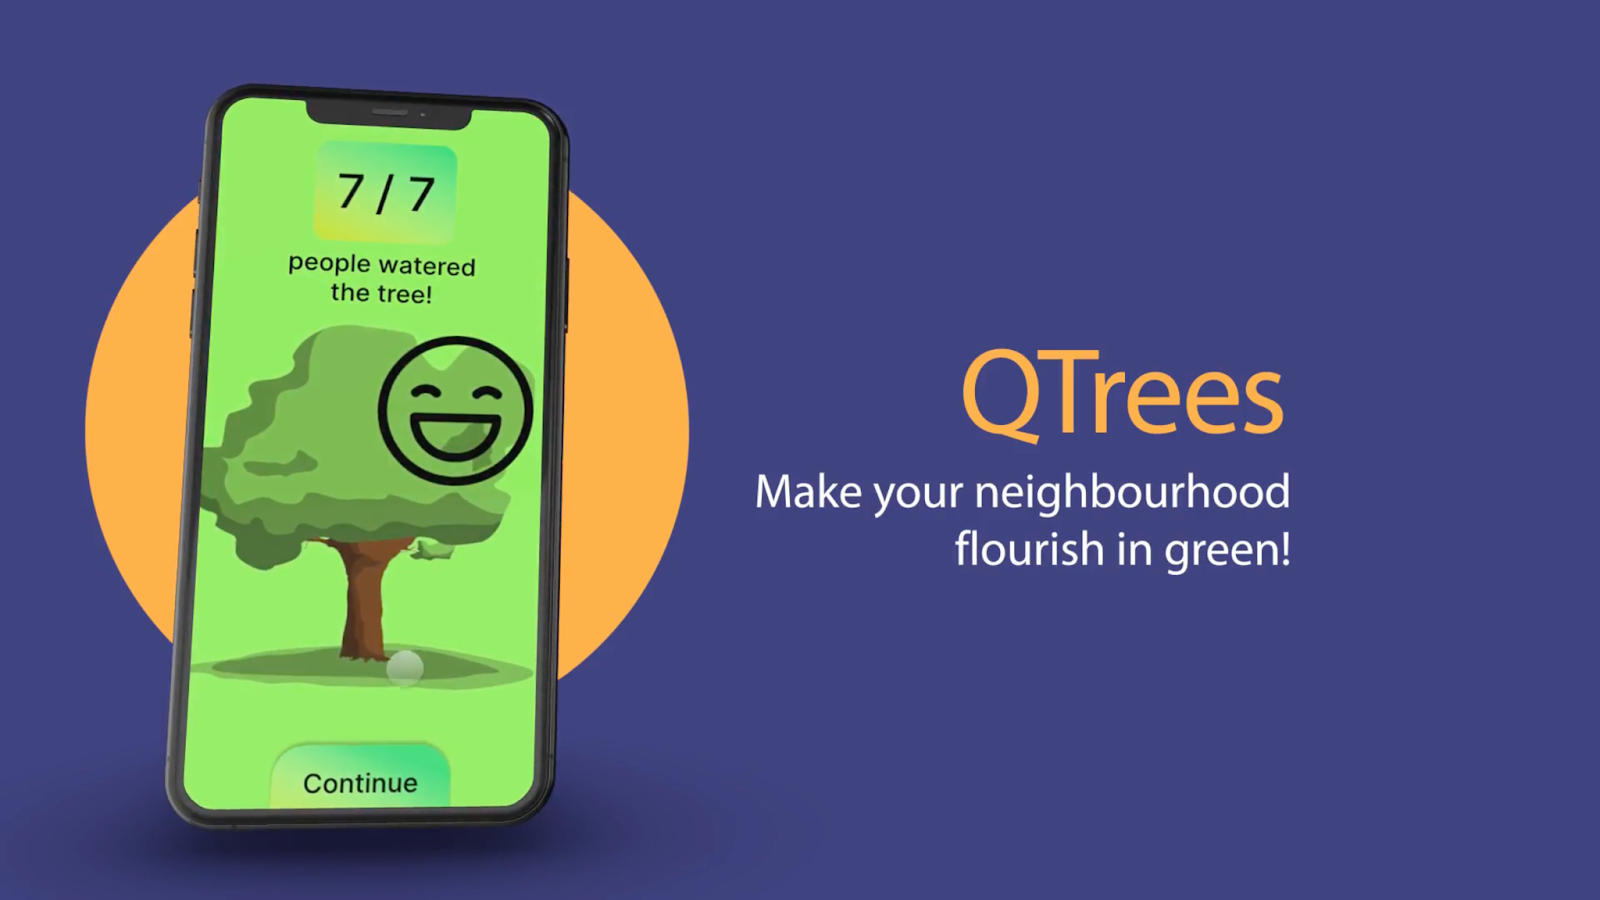
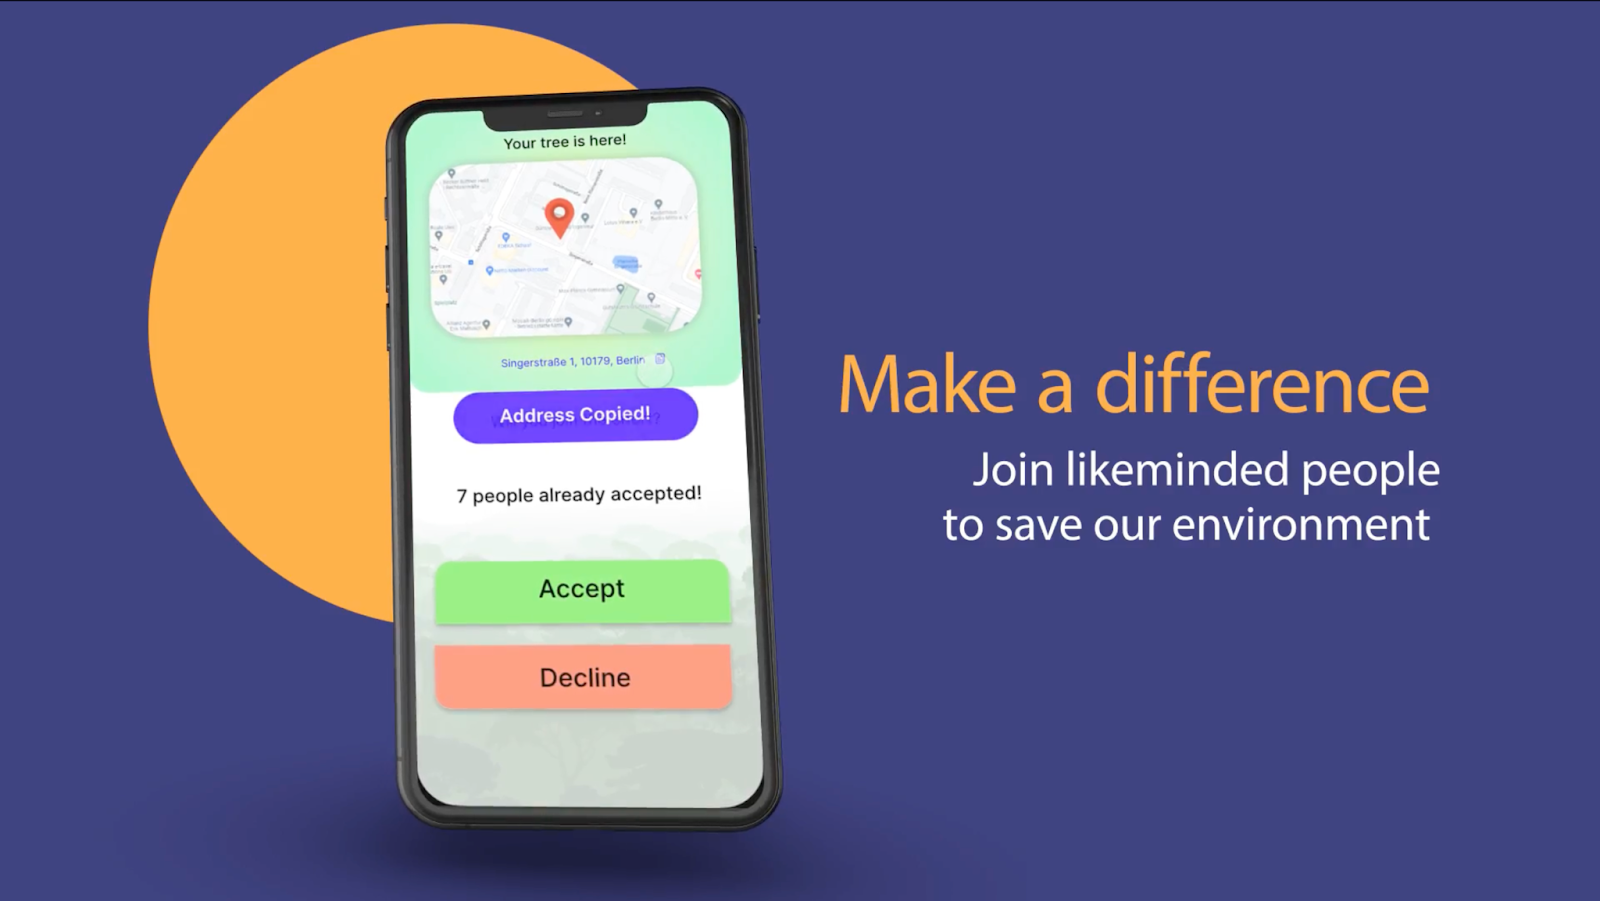
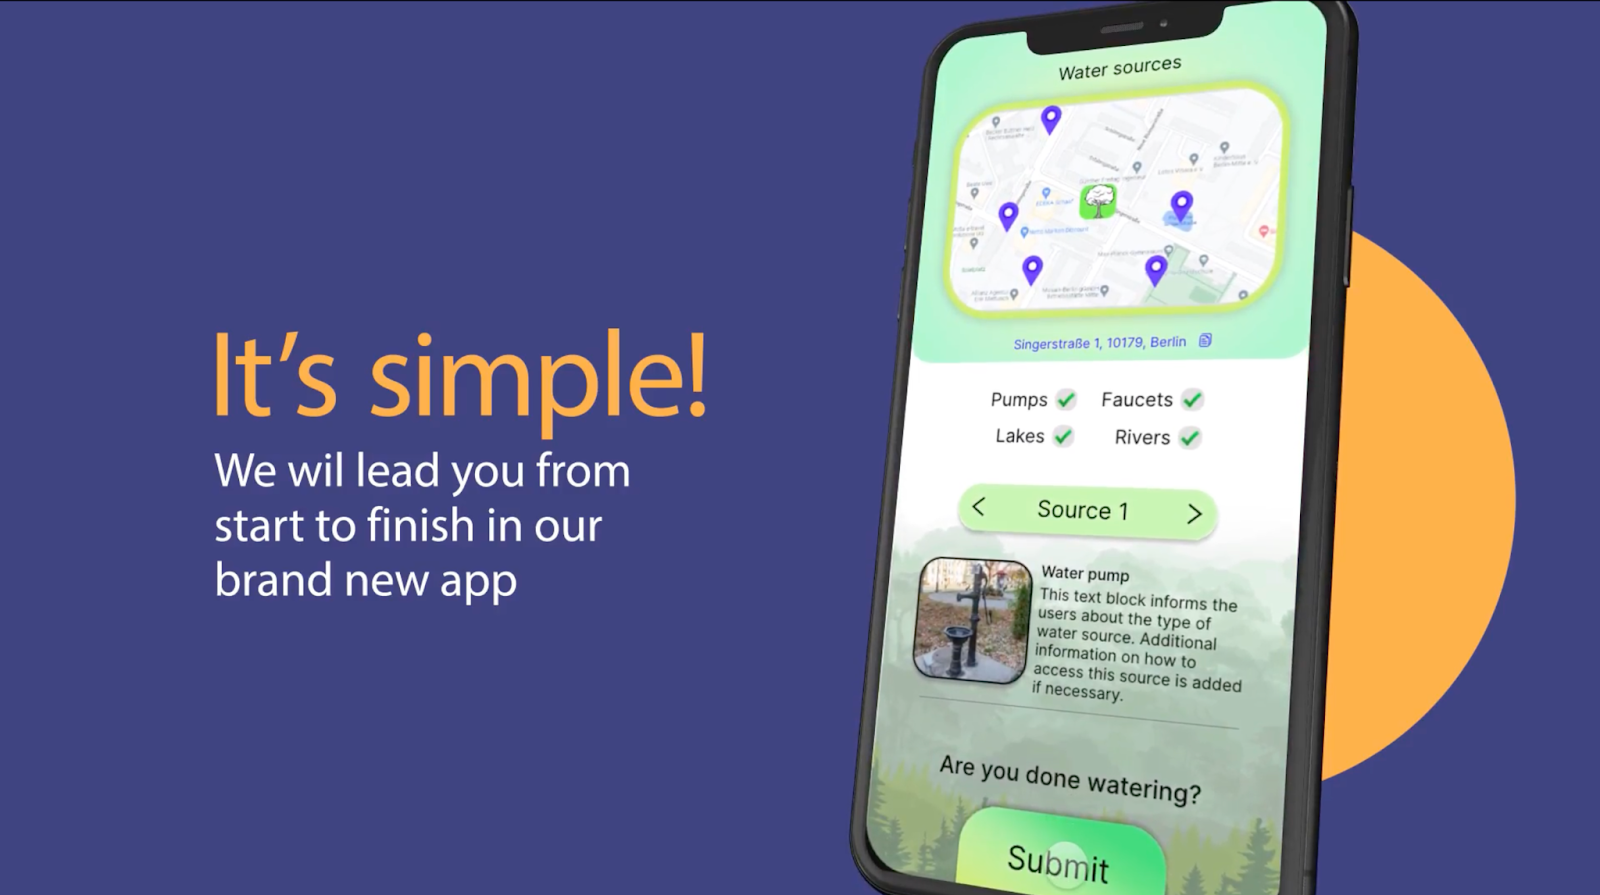
Screenshots: Marek Bröz, Student, University Amsterdam
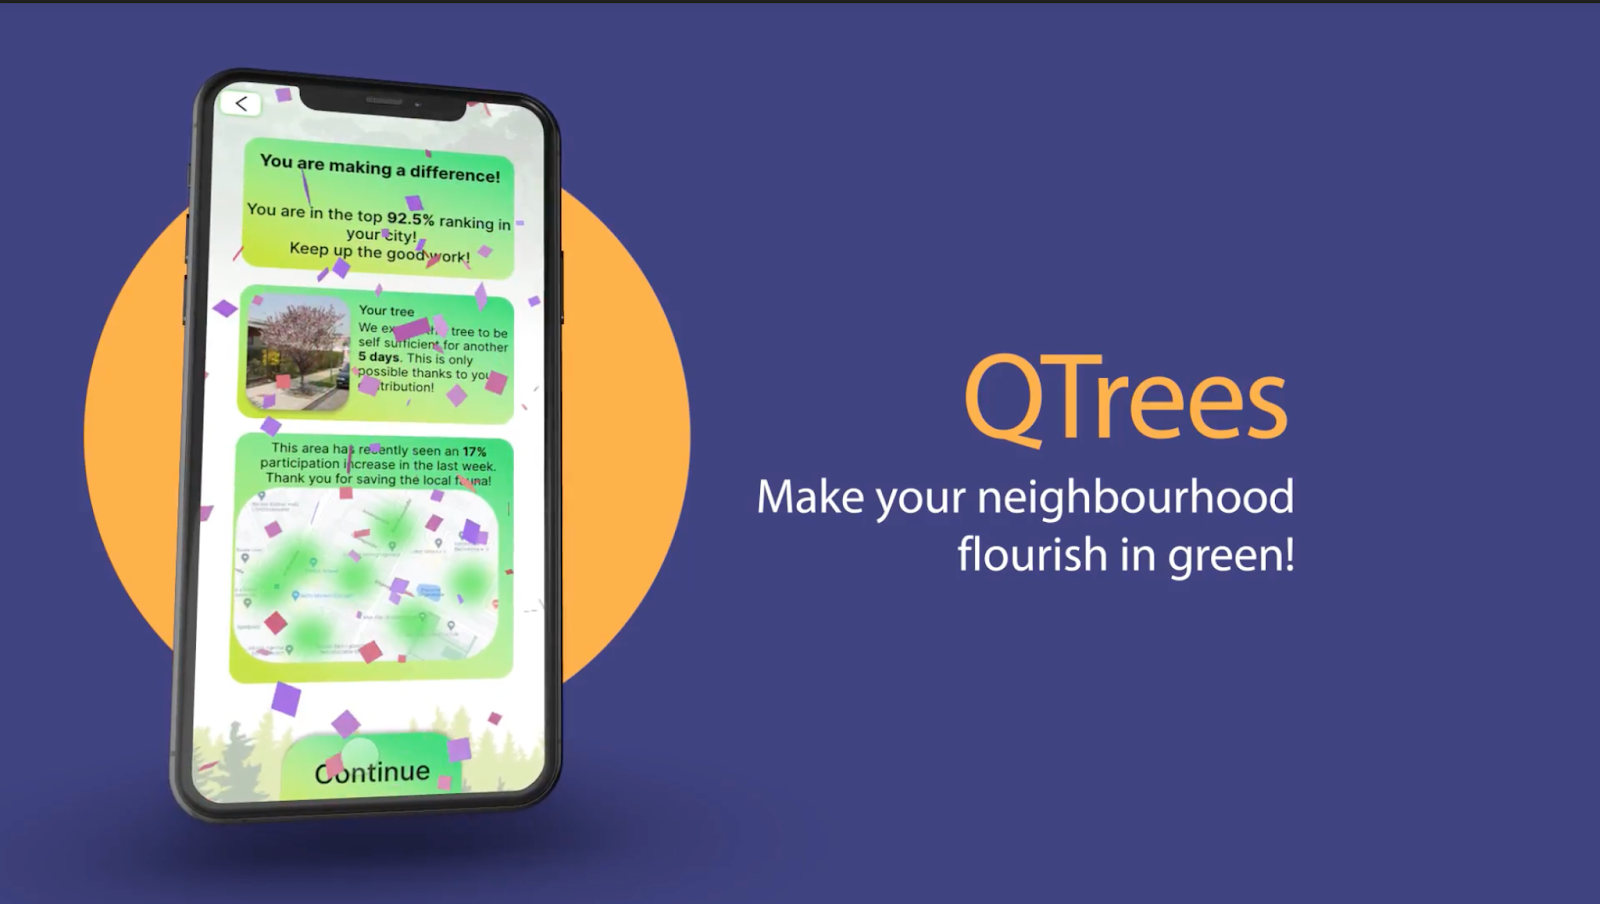
Student Marek Bröz opted for a playful approach. With the help of a smartphone application, the data is to be presented to different target groups in a simplified way. First, a map depicts the user’s surroundings and shows which trees have a high level of water consumption and need watering. The next step is to show the various water sources available such as street pumps, or in some cases rivers or lakes. You can visibly mark your own activities, and the tree can communicate its status based on the active waterers.
Julia Zimmermann, project manager of QTrees, notes: “We can only adapt to climate change in the necessary way by means of constructive collaboration between the public sector and ordinary people. This is precisely why the students’ different creative approaches are so valuable: they make the subject less serious, sensitizing people in a playful way and inspiring them to take action. There’s so much we know about our urban trees based on the open data in Berlin. Artificial intelligence helps us process and analyze large amounts of data, but we need people’s individual creativity to design a platform according to didactic and human aspects. That’s what Marek Bröz’s app demonstrates so clearly.”
For details of the project, see the QTrees-Homepage.
We received lots of great suggestions, designs and drafts, so we had to single out a few selected approaches for this article. But one thing is certain: all the student projects succeeded in handling complex subject matter very comprehensibly within the set time of just a few weeks, and drawing only on digital feedback.
Results like these are a great source of inspiration – not least for our own project work! This again shows how valuable open data is in meeting the various challenges we face in our day-to-day lives and in ensuring a good quality of life in Berlin. It also demonstrates how open data can serve to involve citizens even more closely in what is happening in the city. By developing concrete products, our aim is to persuade all stakeholders in the city to share more interesting data sets with the public.
Conclusion
Whether security, sustainability or digital sovereignty: there are lots of opportunities to tap into open data in Berlin. There are lots of ways in which we can have a common cause for Berlin – as the examples show. We found the dialog, the curiosity of our guests from Amsterdam and the sound collaborative work to be enormous enjoyable. So we’d like to say: Dank je wel!
CityLAB works with students in a variety of different ways. Examples are the exhibition “Let’s get physical”, an interdisciplinary learning format that is part of the Summer School and a series of other activities. Our Newsletter newsletter keeps you up to date on all of CityLAB’s news and offerings.