About the project:
What is the annual energy consumption of the Friedrichstadtpalast? What energy-savings can the refurbishment of the Rotes Rathaus achieve? Which energy source is used to supply the Berliner Philharmonie? The Berliner EnergieCheckpoint enables access to data on the energy consumption and energy savings of public buildings based on exemplary data provided by BIM Berliner Immobilien Management GmbH by visualizing this data at individual locations on a map of the city.
Background:
Berlin is aiming to become climate-neutral by no later than 2045. To this end, the Berlin Climate Protection and Energy Transition Act (EWG Bln) has set a target of reducing carbon dioxide emissions by at least 95 percent compared to 1990. Public buildings such as schools and cultural institutions are to act as role models with their energy-saving and renovation measures. But which buildings consume how much energy, and what potential savings can be achieved by renovating individual buildings?
ODIS looked at existing open data and saw that there was room for improvement in this area in terms of up-to-dateness, continuity, and machine readability. So with the interactive web map Berliner EnergieCheckpoint, we’ve programmed a prototypical application that raises awareness of the Energy Transition Act and the issue of energy saving while at the same time potentially serving as a basis for discussion to improve the situation in terms of administrative data (particularly open data) in the areas of building data and energy monitoring.
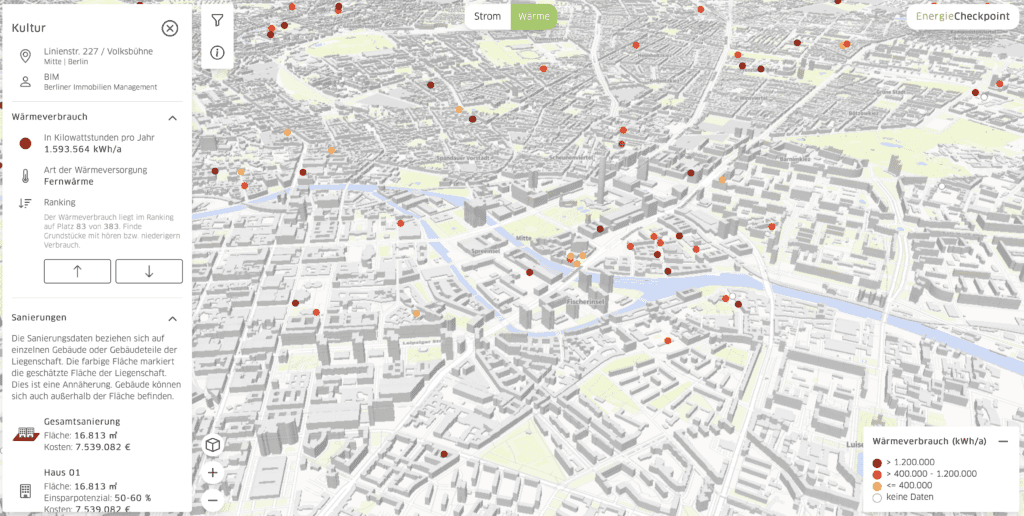
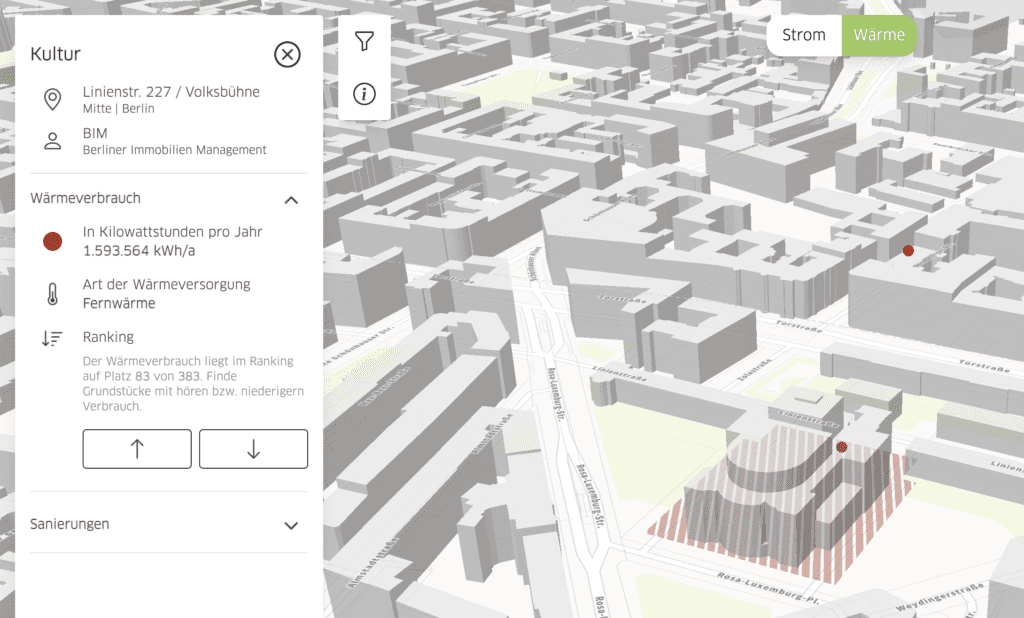
The EnergieCheckpoint visualizes the energy consumption data and savings measures regularly published by BIM Berliner Immobilienmanagement GmbH for over 300 sites such as schools, fire stations and cultural facilities. By clicking on a location, users can obtain information on the building type, heat or electricity consumption and type of heat supply (gas, district heating, etc.).
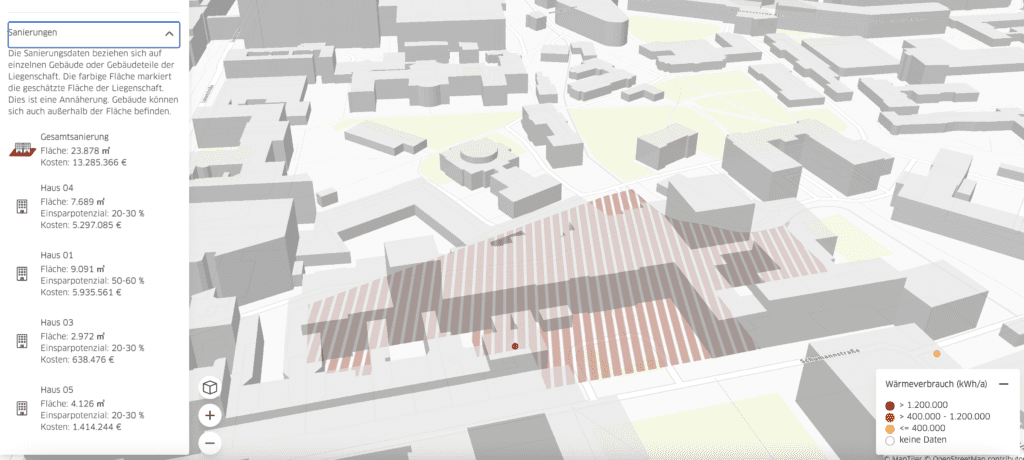
In addition, refurbishment data is displayed for each building or section of the property, showing the cost and surface area of each renovation project. The colored area marks the estimated space occupied by the property: this is only an approximation, however, as buildings may also be located outside the marked space. For individual buildings that can be assigned approximately to an address, information also exists on the surface area of the renovation along with the costs and the savings potential.
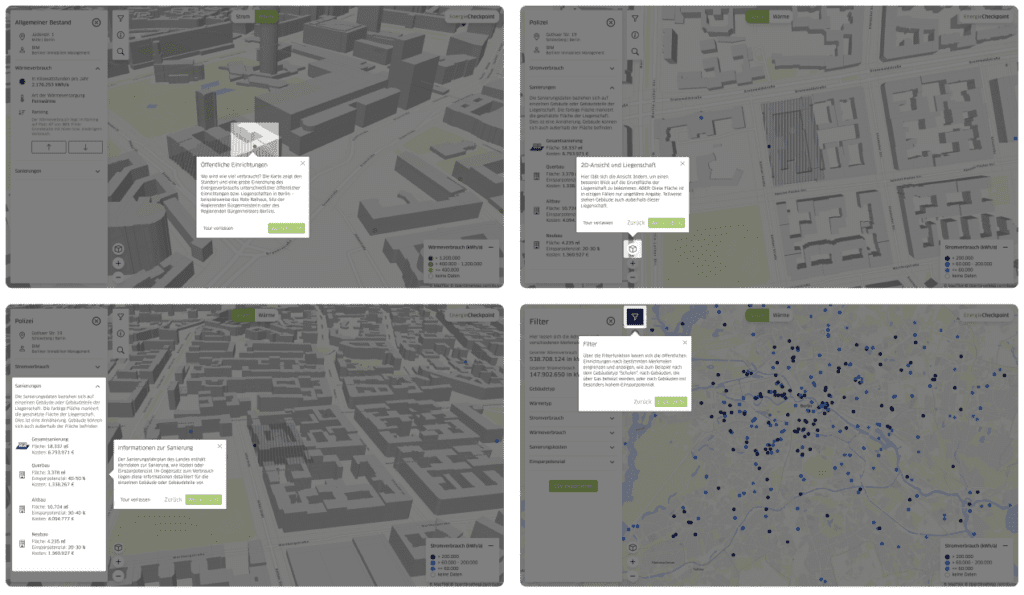
For an easier introduction to the application, a nine-part tour is available if you click on Erkunden in the info box: here the individual functions are explained and put into context in more detail.
The application is designed to switch between the 2D view and the property view.
Data basis and method:
This application is based entirely on restricted open data provided by BIM Berliner Immobilienmanagement GmbH, which publishes an energy consumption overview and renovation roadmap as PDF files under Berichte und Reports every year. For this reason, this data is of limited applicability because it is not yet available as machine-readable data on the Berlin data portal. The current energy consumption overview is available for the year 2020, the status of the data on the renovation roadmap is May 4, 2022. ODIS used open data from the official land register information system (ALKIS) to assign the individual address points to the properties. The processed data and the scripts for data processing are available in this repository.
The processed data and the scripts for data processing are available in this repository.
Who’s involved?
The Berliner EnergieCheckpoint is a project run by the Open Data Information Service (ODIS) in cooperation with CityLAB Berlin. ODIS is supported by the Berlin Senate Department for the Interior, Digitalization and Sports and Investitionsbank Berlin with funds from the State of Berlin and is a project run by Technologiestiftung Berlin.
Contact:
Lisa Stubert, Projektleitung Open Data Informationsstelle
To the Berliner EnergieCheckpoint